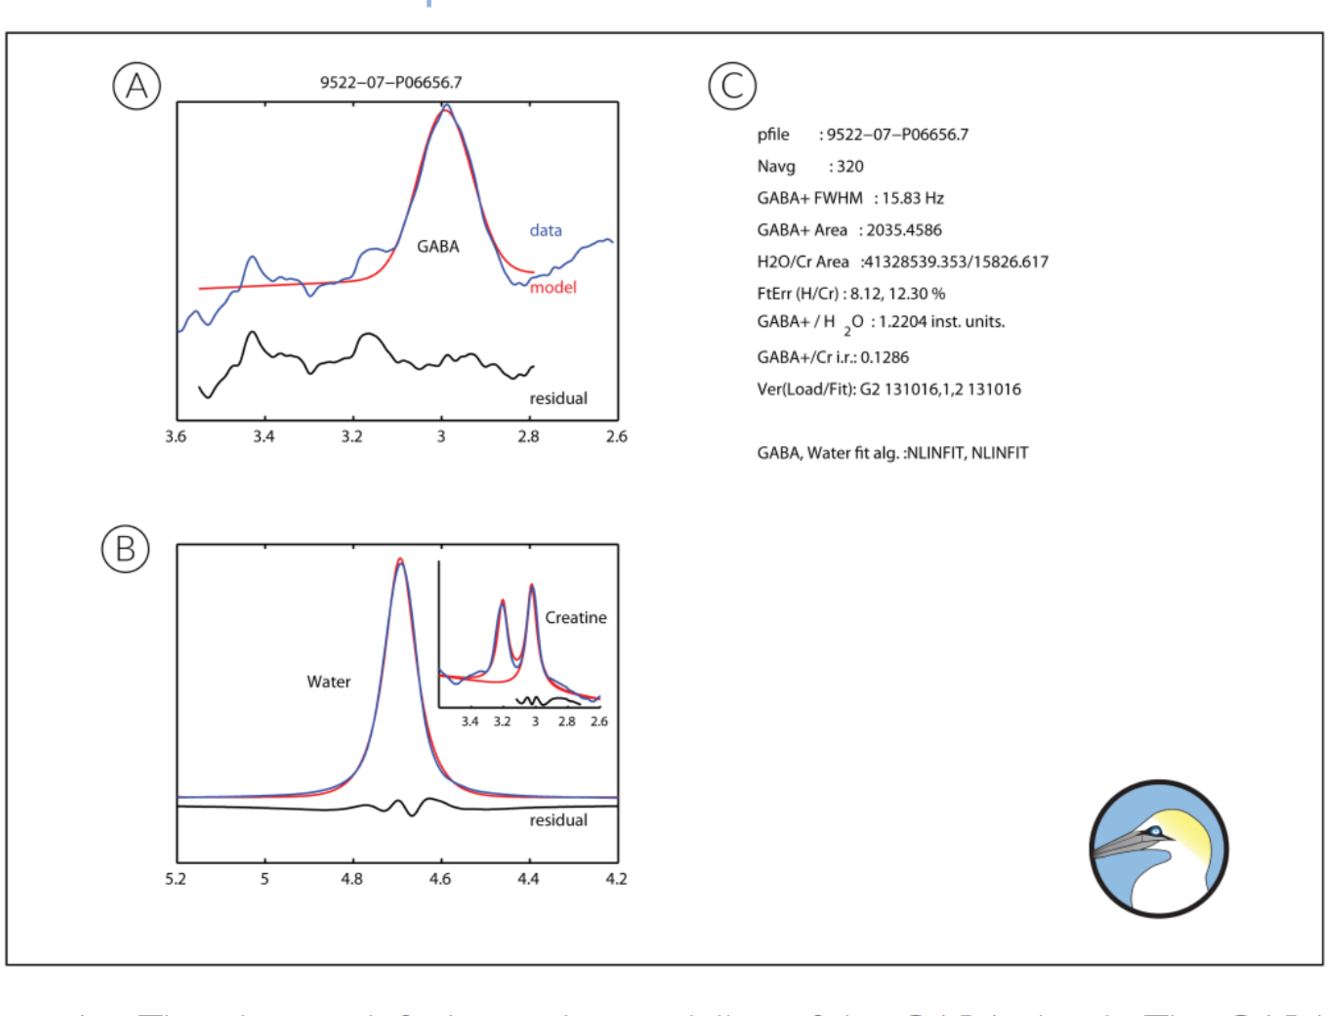
GannetFit Output
A. The plot top left shows the modeling of the GABA signal. The GABA-edited spectrum is shown in blue (across a more limited ppm range than in the GannetLoad output). Overlaid in red is the model of best fit (using a simple Gaussian model by default). Below the plot, the residual between these two is shown in black. B. The plot bottom left shows the modeling of the signal against which GABA is quantified. Again data are blue, models are red and residuals below are black. If no water data is provided, the spectrum shown will be the Cr signal from the OFF spectrum. If unsuppressed water data are supplied, then the main spectrum will be the water signal and the Cr signal will be shown in an inset. The water signal is modeled as a mixed Gaussian-Lorentzian. From Gannet 2.0 onwards, Cr and Choline (Cho) are modeled as two Lorentzians (with the same linewidth and a fixed frequency separation). In red both the full model and the Cr component of that model are shown. C. The right-hand panel contains the results of the fitting, including the file name, number of averages, the width of the fitted GABA signal, the integral area of GABA, Cr and water models, the fit error of the models (defined as the standard deviation of the residuals expressed as a percentage of the signal height), the GABA concentration expressed in institutional units relative to water and as an integral ratio relative to Cr, and the code versions of GannetFit and GannetLoad used.